Wildfires and Air Quality in Los Angeles
Air Quality Map
This map shows air quality in Los Angeles based on data from outdoor PurpleAir sensors.
What do the colors mean?
- ● Good: little to no risk.
- ● Moderate: some pollutants are present but not usually harmful.
- ● Unhealthy for Sensitive Groups: people with health conditions may be affected.
- ● Unhealthy: everyone may start to feel effects.
- ● Very Unhealthy: serious health effects may occur for everyone.
- ● Hazardous: emergency conditions; the entire population is more likely to be affected.
If you see many orange, red, or purple markers, the air quality is significantly worse than usual.
Frequently Asked Questions (FAQs)
How often is this updated?
This page is updated automatically every hour, ensuring near real-time information.
What’s the purpose of this page?
To make air quality information in Los Angeles more accessible and easier to understand, especially during wildfire events
Why should I care about air quality?
Even if you’re healthy, someone you care about might not be. Poor air quality can be dangerous for people with asthma, allergies, or heart conditions, as well as for older adults and pets.
Where does this data come from?
The air quality data comes from affordable, community-installed PurpleAir sensors located throughout the Los Angeles area.
What’s coming next?
- Adding wildfire perimeters
- Visualizing wind direction and speed
- Integrating EPA air quality data
- Timelapse visualization of 2025 LA wildfires
Additional Information
What is PM2.5?
PM2.5 refers to tiny particles in the air that are 2.5 microns or smaller. These particles can enter your lungs and bloodstream, causing health issues.
Common sources include:
- Wildfires
- Car exhaust
- Industrial emissions
What is AQI?
The Air Quality Index (AQI) is a standardized scale that helps translate pollution levels into something easy to understand.
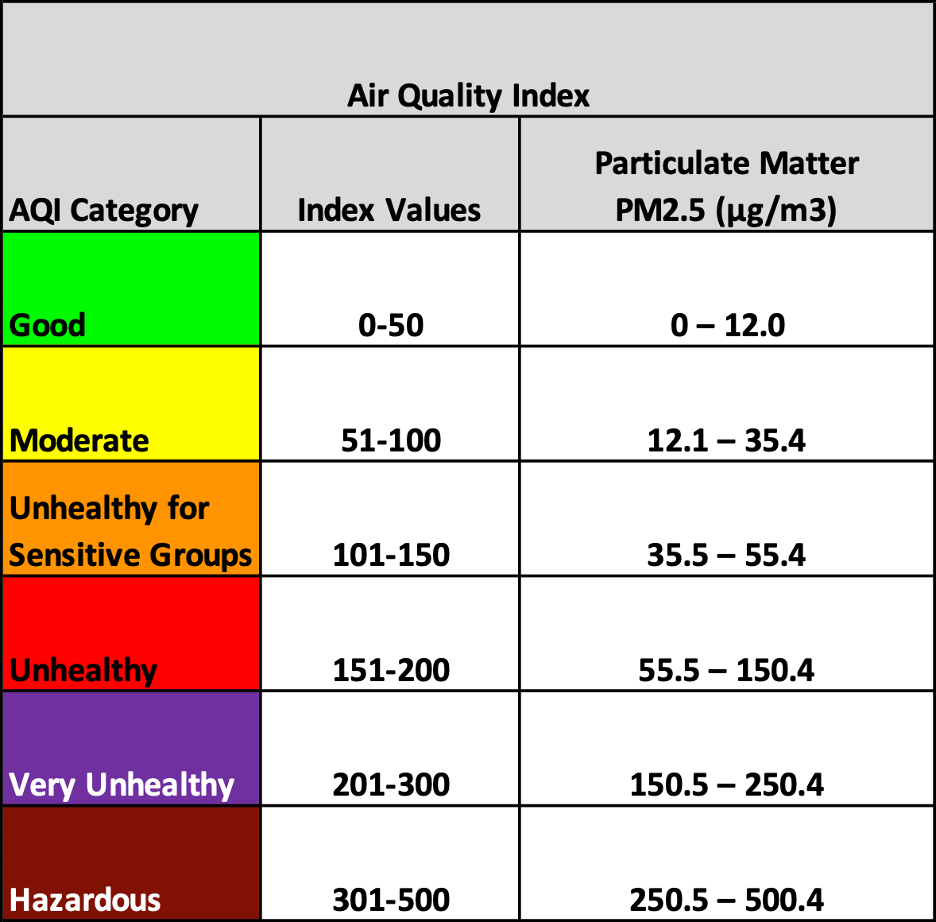
*While official AQI uses 24-hour averages, this map shows recent 30-minute readings to help you stay informed about rapid changes in air quality.
Resources
- Current Wildfire Emergency Incidents
- Click on an incident to view detailed maps and evacuation zones, such as the Palisades Fire
- Free mobile app for real-time wildfire alerts
- Available on App Store, Google play and Web
- Official EPA air quality visualization
- Community-sourced air quality data
Disclaimer
This page is a work in progress and should be used for informational purposes only. For official updates and health recommendations, refer to trusted sources.